
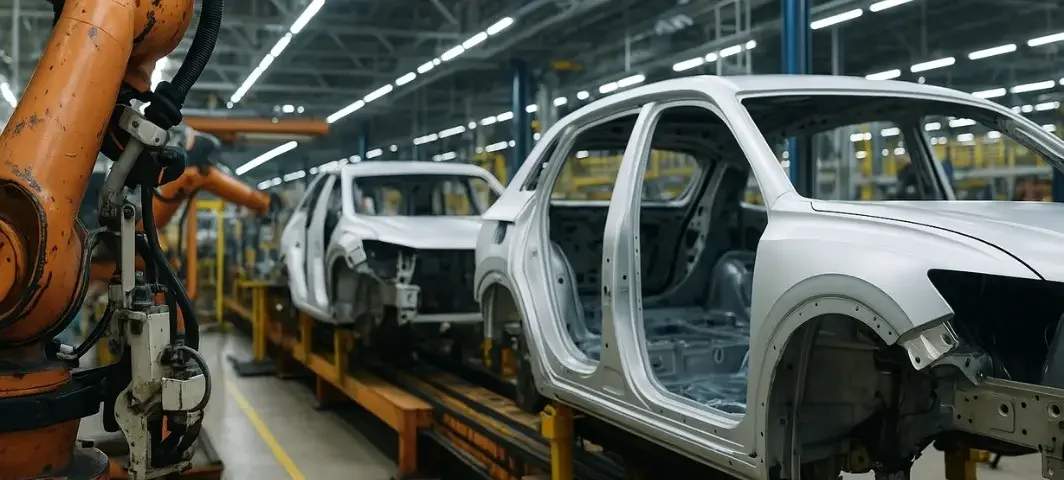
A line makes what its slowest station allows. Every other station can only wait for it. That sounds obvious, yet most plants live with more of it than they realize, because the stations that wait never show up as a problem. Output looks steady. The slow station gets the attention, and the uneven work content that caused the slowdown stays exactly where it is.
This post covers what uneven work content looks like, where it costs you, and what line balancing software should show your team.
What uneven work content looks like
On an unbalanced line, work content is uneven: some stations are overloaded and others are waiting. Industrial engineers draw this with a Yamazumi chart, a stacked bar chart from Toyota’s lean toolkit. Each bar is a station, each segment is a work element, and a line across the chart marks takt time. One look shows which bars cross the takt line and which sit well below it.
How to read the chart on your own line
Start with takt time, the pace your customer demand sets, and draw it as a horizontal line. Then stack the work elements for each station and look at the bars. Bars above the line cannot keep pace. Bars far below it hold capacity you cannot use yet.
The chart also shows what you could move. A short, movable element on an overloaded station, next to a station with room, is the first candidate. Check that the move makes sense on the floor: the element has to fit the sequence, the tooling and the reach at the receiving station.
Where the cost shows up
Throughput. The slowest station sets the pace. To size the loss, calculate line balance efficiency: total work content divided by the number of stations times the slowest station’s time. Fabrico’s Yamazumi guide walks through the method.
Here is an illustration with made-up numbers. A four-station line runs at 44, 57, 36 and 43 seconds against a takt time of 50 seconds. Total work content is 180 seconds. Efficiency is 180 divided by 228, or about 79 percent. The 57-second station cannot keep up with takt, so the line runs about 12 percent short of the rate the customer needs.
Waiting time. In that illustration, the 36-second station waits 21 seconds every cycle for work to arrive, because the line moves at the pace of its slowest station (57 seconds), not at takt. The stations at 44 and 43 seconds wait 13 and 14 seconds. That wait belongs to the way work content splits across the line, not to the people at the station. Evening out the split gives the overloaded station relief, and every station stays inside takt.
Overtime. When a line falls short, plants make up the volume with overtime, expedited shipments or an extra shift. Balancing aims at the opposite result: absorbing volume without adding overtime.
Rushed work. A station with more content than its cycle time allows invites shortcuts: a skipped check, an awkward reach to save a second, a verification step that gets cut. Those shortcuts do not point to a people problem. The station never had enough time to do the job properly, and that is a design problem. Fixing it protects quality and reduces strain.
Why balance drifts
A line balanced last spring will not stay balanced. Product mix changes the work content at each station. Shifts change material staging and handoffs. Fixtures wear. A new variant can move the constraint to a station that never mattered before.
A time study measures one station on one day, so it starts aging the moment someone finishes it. Balancing from old studies means balancing a line that no longer exists.
What line balancing software should do
Software should work from recorded cycles, not hand-entered estimates. In our system, cameras record every cycle and break it into work, wait, pick and walk time at each station they cover. You see the bottleneck and the reason behind it, with footage, instead of arguing about the average. Our time study breakdown gives your team the starting point, and our production management view shows cycle times, throughput and wait time linked to video.
Look for the same station view across shifts, since the constraint often moves between them. Ask each vendor whether its software also shows cuts by product variant.
Software shows where work content is uneven. Your IEs still decide what moves, whether that means shifting an element between stations, changing how material arrives, or re-sequencing a task. We do not claim our software rebalances the line for you, and any tool that promises that deserves a hard look.
A consistently slow station is still your constraint, so start there. Once you have moved work off it, look at the spread. A station with a wide gap between its fastest and slowest cycles makes the stations around it harder to plan for.
Mistakes to avoid when rebalancing
- Balancing to the average. A station that averages under takt can still run over it on one shift or one variant.t shows averages with no spread.
- Moving work without checking the receiving station’s tooling, reach and space.
- Treating balance as a project. Product mix and fixtures keep changing, so the picture needs a refresh.
- Skipping the people who work the line. They know which elements fit together and which do not.
- A change that looks right on a chart and wrong at the station will not last.
What balance means for the floor
Balanced work content makes the job more sustainable. People get fewer rushed cycles, fewer strained reaches and fewer mid-shift scrambles to catch up. The fix lands on the station and its work content, not on the people working at it.
How to start
Pick one line and one takt time. Collect a week of station data across shifts. Stack the stations against takt. Move one work element away from the most overloaded station, then check whether the change held over the following week.
One automotive supplier using our system met its target takt time within four hours of implementation and raised throughput by 63 percent, from 320 to 520 parts per shift, according to our case study. Two of the fixes were design changes: shortening a torque gun’s auto-cycle, within allowable limits, on a station overloaded with work content, and moving material closer to the point of use to cut walking. That is one supplier’s result on one line. Yours will differ, so measure it.
See where your work content is uneven
At Invisible AI we built our vision execution system so IE teams can see work and wait time at each station our cameras cover, with footage behind each number. If you want to see where work content is uneven on one of your own lines, we would be glad to review it with you. Request a demo.